
TL;DR Summary
SaaS unit economics shows whether your growth is actually healthy. This guide explains CAC, LTV, gross margin, churn, LTV:CAC, and CAC payback in plain language so you can stop funding weak acquisition and make better growth decisions.
It’s easy to get excited about SaaS growth when signups are increasing.
However, more signups don’t always mean your business is healthy.
A SaaS company can bring in more revenue but still lose money on every new customer. You might celebrate a spike in users one month, only to lose money as others leave. That’s why unit economics are important.
SaaS unit economics help you see if each customer brings in enough profit to cover what it costs to acquire them.
Put simply:
If each customer is profitable, your growth has a solid base.
If you lose money on each customer, growing just makes the problem worse.
This guide breaks down the key SaaS unit economics numbers in plain language: CAC, LTV, LTV:CAC, payback period, gross margin, and churn.
No financial jargon. No vanity metrics.
You’ll see only the numbers that reveal whether your SaaS growth is truly healthy or just burning cash.
What are SaaS unit economics?
SaaS unit economics looks at the money earned and spent for one customer or account.
Instead of asking:
“How much revenue did we make this month?”
You ask:
“Does each customer bring in more money than it costs to get, support, and keep them?”
That question can feel uncomfortable.
But it is important to ask.
Top-lineTotal revenue can sometimes hide problems with your business model. Any can have growing MRR and still be in trouble if:
- CAC is too high
- Churn is too high
- Gross margin is weak
- The payback period is too long
- Low-quality customers are being acquired
- The best customers are mixed with bad-fit customers in one blended average
SaaS works on subscriptions. Customers pay over time. This means you usually spend money first to get a customer, then get that money back slowly through monthly or yearly payments.
That is why unit economics matter more in SaaS than in businesses that sell something only once.
Making a sale is not the end goal.
Keeping customers is where the real numbers show up.
The simple SaaS unit economics formula
At a high level, SaaS unit economics comes down to this:
The value from a customer must be more than the cost to get them.
The practical version looks like this:
Healthy SaaS growth means LTV is much higher than CAC, and you get back your CAC fast enough to keep your cash flow steady.
That gives us three core questions:
- How much does it cost to acquire a customer?
- How much value does that customer generate before leaving?
- How long does it take to recover the acquisition cost?
Those questions map to three metrics:
- CAC — Customer Acquisition Cost
- LTV — Customer Lifetime Value
- CAC Payback Period — how long it takes to recover CAC
If you only remember one thing from this article, remember this:
LTV:CAC shows if getting a customer makes money.
CAC payback shows if you can last long enough to see that profit.
Both are important.
1. Customer Acquisition Cost: What Growth Really Costs
Customer Acquisition Cost, or CAC, is the average amount of money you spend to get one new customer.
The simple formula is:
CAC = Sales and marketing cost ÷ Number of new customers acquired
Example:
If you spent $10,000 on sales and marketing in a month and acquired 100 new customers, your CAC is:
$10,000 ÷ 100 = $100 CAC
That part is easy.
The hard part is being honest about what counts as sales and marketing costs. Founders calculate CAC only from ad spend.
That gives you a misleading number.
A complete CAC should include all costs directly linked to getting customers, such as:
- paid ads
- sales salaries
- marketing salaries
- sales commissions
- agency fees
- freelancer costs
- CRM and sales tools
- marketing automation tools
- content production
- landing page and creative costs
- webinar or event costs
- affiliate or partner commissions
You do not have to make CAC complicated.
But you do need to make sure it is accurate.
If it helped acquire the customer, it probably belongs in the CAC calculation.
Average CAC versus channel CAC
Average CAC is the cost averaged across all ways you get customers.
It helps see the big picture, but it can hide the real details.
Example:
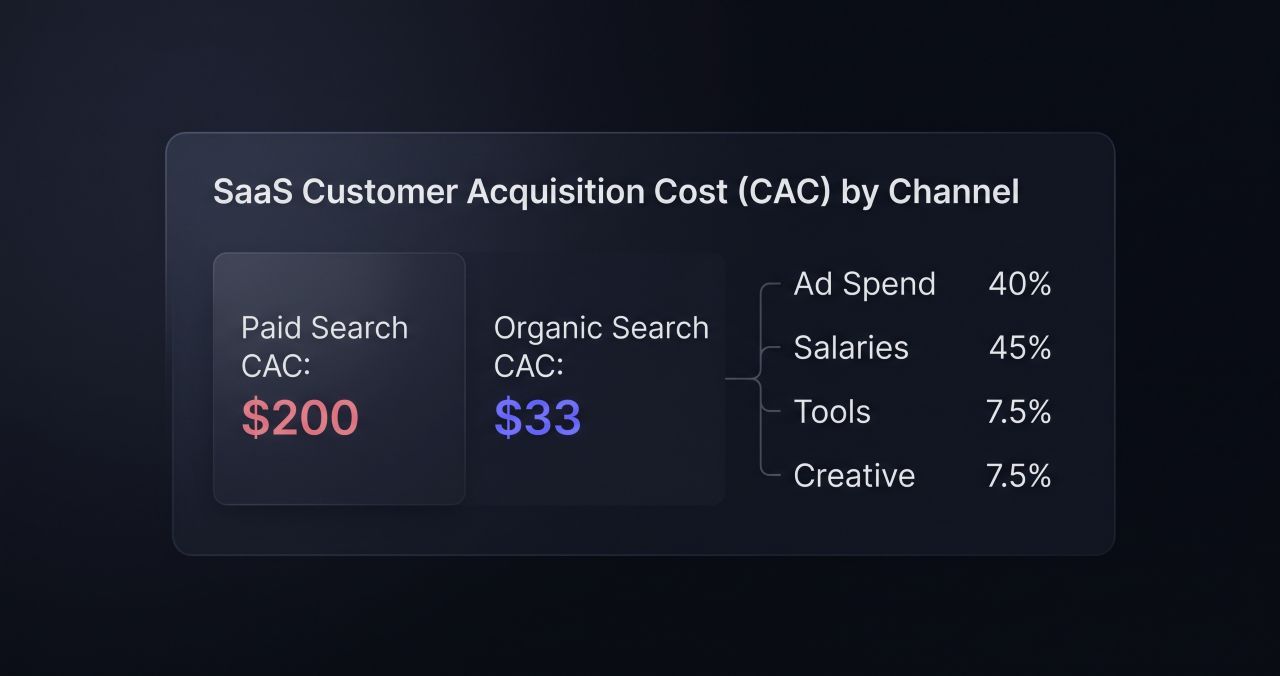
ChannelSpendNew customersCACPaid ads$8,00040$200Organic SEO$2,00060$33Total$10,000100$100 blended CAC
The blended CAC looks like $100.
But paid ads are bringing customers at $200 each, while organic is bringing customers at $33 each.
That is a different story.
That is why you should track CAC for each channel when you can.
At a minimum, separate:
- paid CAC
- organic CAC
- outbound CAC
- partner or affiliate CAC
- sales-led CAC
- self-serve CAC
One overall CAC number can hide a weak channel because a stronger channel covers for it.
This is how teams end up spending too much on acquisition without realizing where the problem is.
2. Lifetime Value: what a customer is worth
Lifetime Value, or LTV, estimates how much profit a customer brings before they leave.
A simple SaaS LTV formula is:
LTV = Average revenue per account × Gross margin ÷ Customer churn rate
Example:
- Average revenue per account: $100/month
- Gross margin: 80%
- Monthly customer churn: 5%
Then:
$100 × 80% ÷ 5% = $1,600 LTV
This means the average customer is expected to generate around $1,600 in gross profit throughout their lifetime.
This number is only a guess.
LTV can change fast. Even small changes in churn make a big difference.
If monthly churn increases from 5% to 8%, the same customer’s LTV becomes:
$100 × 80% ÷ 8% = $1,000 LTV
Nothing changed in pricing.
Nothing changed in the acquisition.
But the value of the customer dropped because they leave faster.
This is why churn goes beyond being a retention measure.
Churn directly affects how much you can spend on growing your business.
ChartMogul explains LTV as a key SaaS metric and also notes that LTV:CAC helps assess the monetary health and development potential of a SaaS business.
A caution about LTV
LTV is useful.
But it can also give you a false sense of confidence.
The problem is that LTV is based on guesses.
If your SaaS is new, your churn data might not be reliable. You may not know how long customers really stay. You might also have different groups of customers who behave very differently.
For example:
SegmentARPAMonthly churnLTV qualitySmall teamsLowHighWeakMid-marketMediumMediumBetterEnterpriseHighLowStrong
If you use one average LTV for all customers, you might miss important details.
Your SaaS may not have one business model.
It may have several customer segments behaving very differently.
That is why LTV should be broken down by:
- plan
- customer size
- acquisition channel
- use case
- geography
- sales motion
- product usage level
- signup cohort
The goal is not to build a perfect spreadsheet.
The goal is to avoid making growth decisions based on averages that hide what is really going on.
3. Gross margin: the metric many founders skip
Gross margin is the percentage of revenue left after the direct cost of delivering the service.
The formula is:
Gross margin = (Revenue minus cost of goods sold) divided by Revenue
For SaaS, cost of goods sold may include:
- hosting
- infrastructure
- customer support
- payment processing
- third-party API costs
- onboarding costs directly tied to service delivery
- customer success costs related to support or service delivery
SaaS businesses often have good gross margins because software can scale well. But not every SaaS company has the same margin.
AI tools, API-heavy products, usage-based products, and high-support B2B tools can have very different cost structures.
This matters because LTV should be based on gross profit, not just revenue.
A customer paying $100/month with a 90% gross margin is not the same as a customer paying $100/month with a 50% gross margin.
Revenue is the same.
But the economics are not.
IBM describes SaaS as a model where providers host applications and make them available over the internet, while the provider manages and administers the software and infrastructure. That delivery responsibility is exactly why infrastructure and support costs matter in SaaS margin calculations.
4. LTV:CAC ratio: the health check
LTV:CAC compares how much value a customer creates against how much it costs to acquire them.
The formula is:
LTV:CAC = Lifetime Value ÷ Customer Acquisition Cost
Example:
- LTV: $1,500
- CAC: $500
Then:
$1,500 ÷ $500 = 3:1 LTV:CAC
A 3:1 ratio is commonly used as a healthy SaaS benchmark. It means you generate about $3 in lifetime gross profit for every $1 spent to acquire the customer. ChartMogul also describes a 3x LTV-to-CAC target as a sustainable viability benchmark for SaaS businesses.
But do not treat 3:1 as a law.
It is a signal.
A 1:1 ratio usually means acquisition is too expensive or retention is too weak.
A 3:1 ratio often suggests acquisition has room to work.
A 5:1 ratio might mean your business is very efficient, or it could mean you are not investing enough in growth.
The context matters.
For example, a bootstrapped SaaS may prefer a stronger ratio and shorter payback because cash is limited.
A funded SaaS may accept a longer payback if retention is strong and expansion revenue is clear.
A self-serve SaaS should usually expect faster payback than an enterprise SaaS with long sales cycles.
So use LTV:CAC to diagnose your business, not simply as a number to show off.
5. CAC payback period: the cash-flow test
LTV:CAC tells you whether the customer is valuable.
CAC payback tells you how long it takes to recover the money you spent to acquire that customer.
The formula is:
CAC Payback Period = CAC ÷ Monthly gross margin per customer
Example:
- CAC: $600
- Monthly revenue per customer: $100
- Gross margin: 80%
- Monthly gross margin: $80
Then:
$600 ÷ $80 = 7.5 months
That means it takes 7.5 months to recover the acquisition cost.
This is one of the most useful SaaS metrics because it links your growth to your cash flow.
A company can have a strong LTV:CAC ratio and still struggle if payback is too slow.
Maxio notes that CAC payback helps identify overspending, retention issues, pricing problems, and cash-flow bottlenecks that may not show up if you only look at LTV:CAC.
That is the key point.
A customer may be profitable over three years. But if payback takes too long, the business can still run short on cash before it sees that profit.
But if you need 24 months to recover CAC and your runway is short, that customer can still create cash pressure.
This is where SaaS growth becomes practical.
Not every profitable customer is affordable to acquire right now.
A simple example: when growth looks good, but economics are weak
Imagine a SaaS company with these numbers:
- Monthly new customers: 100
- CAC: $400
- ARPA: $50/month
- Gross margin: 80%
- Monthly churn: 5%
Now calculate the basics.
Monthly gross margin per customer:
$50 × 80% = $40
LTV:

$50 × 80% ÷ 5% = $800
LTV:CAC:
$800 ÷ $400 = 2:1
CAC payback:
$400 ÷ $40 = 10 months
At first, this does not look terrible.
The payback period is 10 months. That is manageable for many SaaS companies.
But the LTV:CAC ratio is only 2:1. That means the business does not have much room for error.
If churn rises, paid acquisition becomes risky.
If CAC increases, growth becomes less attractive.
If the company has a long sales cycle or heavy support costs, the economics get weaker.
Now imagine the same SaaS improves onboarding and reduces churn from 5% to 3%.
New LTV:
$50 × 80% ÷ 3% = $1,333
New LTV:CAC:
$1,333 ÷ $400 = 3.3:1
CAC did not change.
Pricing did not change.
Acquisition did not change.
The business improved because retention improved.
This is why you cannot separate growth from the product experience.
Better activation and retention can make acquisition more affordable.
Churn is often an activation problem
Many founders try to fix churn too late.
They wait until the user clicks cancel. Then they send discounts, reminder emails, or “please stay” messages.
Sometimes that helps a little.
But in many cases, the churn decision happened much earlier.
The user signed up but did not reach the value.
They never completed the setup.
They did not invite the team.
They did not connect the system integration.
They did not understand the first useful workflow.
They failed to remember why they signed up.
So when users cancel, it is often just a delayed result of earlier problems.
For SaaS, activation is the bridge between acquisition and retention.
If activation is weak, unit economics usually suffers.
Weak activation leads to:
- lower trial-to-paid conversion
- lower product usage
- higher churn
- lower LTV
- weaker LTV:CAC
- longer payback
- more pressure on acquisition
So before spending more on acquisition, ask:
- What is the first meaningful outcome users want?
- How long does it take to reach that outcome?
- Where do users drop off?
- Which actions predict retention?
- Are we steering users to value or just giving them a dashboard?
- Are we attracting the right users in the first place?
You cannot fix a product value problem just by sending more emails.
You have to help users reach value faster.
The Unit Economics Leak Map
If your unit economics look weak, do not panic.
Diagnose the leak.
Here is a simple way to think about it:
SymptomLikely leakWhat to checkCAC is risingAcquisition efficiency problemChannel quality, targeting, conversion rate, sales cycleLTV is fallingRetention or margin problemChurn, ARPA, gross margin, expansionLTV:CAC is below 3:1Growth quality problemCAC, churn, pricing, customer segmentPayback is too longCash-flow problemCAC, ARPA, gross margin, annual prepay, sales cycleChurn is highActivation or fit problemOnboarding, use case, product value, wrong audienceRevenue grows but cash burns fasterScaling problemSpend efficiency, hiring, paid channels, payback period
This table is more useful than staring at one blended dashboard.
Every weak number has a cause.
Find the cause before changing the tactic.
What good SaaS unit economics look like
There is no perfect benchmark for every SaaS company.
A self-serve product, an enterprise SaaS, a usage-based platform, and an AI tool can all have different economics.
But generally, healthy SaaS unit economics have these qualities:
- CAC is tracked honestly
Growth mechanics, zero fluff.
Join SaaS founders and operators getting weekly notes and tear-downs on organic acquisition and churn reduction.
- LTV is based on gross margin, not just revenue
- LTV:CAC is comfortably above the acquisition cost
- CAC payback is short enough for the company’s cash position
- Churn is understood by segment
- The best channels bring the best-fit customers
- pricing reflects the value delivered
- retention improves over time
- Growth does not depend on hiding weak channels inside blended averages
That last point is important. Rages are dangerous.
One average number can hide that some customer segments are profitable, while others are quietly hurting your business.
How to improve SaaS unit economics
You can improve unit economics from three directions:
- Reduce CAC
- Increase LTV
- Shorten the payback period
Here is how you can put that into practice.
Reduce CAC
You can reduce CAC by improving:
- landing page conversion
- audience targeting
- organic search
- referral loops
- partner channels
- sales qualification
- onboarding content
- demo-to-close rate
- pricing page clarity
- product-led acquisition
But do not try to lower CAC by cutting costs without thinking it through.
Sometimes spending more on the right channel improves economics because customer quality is better.
The aim is not just to make acquisition cheap.
The goal is to make acquisition profitable.
Increase LTV
You can increase LTV by improving:
- activation
- retention
- expansion revenue
- pricing
- packaging
- customer success
- product stickiness
- onboarding
- annual plans
- use-case fit
The quickest way to improve LTV is often by reducing churn among your best-fit customers.
Not every customer needs the same amount of effort to keep them.
Focus on the customers who match your product’s strongest use case.
Shorten the payback period
You can shorten payback by:
- reducing CAC
- improving conversion
- increasing ARPA
- improving gross margin
- encouraging annual prepayment
- improving sales efficiency
- reducing onboarding/support cost
- targeting faster-converting segments
A shorter payback period gives your company more flexibility.
It means you do not have as much cash tied up in growth.
Do this, not that
Use this as a quick audit.
Do thisNot thatCalculate fully loaded CACCount only ad spendTrack CAC by channelRely only on blended CACUse gross-margin-based LTVUse revenue-only LTVSegment LTV by customer typeTreat all customers as equalWatch CAC paybackLook only at LTV:CACFix activation before scaling spendPour more traffic into a leaky funnelStudy churn reasonsTreat churn as only a numberConnect pricing to valueCopy competitor pricing blindlyImprove the best-fit segmentChase every possible user
This is not complicated to understand.
But it does require honesty.
And a lack of honesty is where many growth plans fail.
Where SaaS founders usually get this wrong
The biggest mistake is treating unit economics as an investor slide.
It should be part of how you run your business every day.
You should use these numbers to decide:
- Which channel deserves more budget
- Which customer segment to prioritise
- Whether pricing needs to change
- Whether onboarding is hurting retention
- Whether paid acquisition is scalable
- Whether SEO is bringing better-fit customers
- Whether the sales motion is too expensive
- Whether churn is killing LTV
- whether the business can afford its current growth pace
Unit economics should help you make better decisions.
If the numbers do not lead to changes, you are simply reporting, not managing.
You are not actually managing your growth.h.
A simple monthly unit economics review
You do not need a complicated financial team to get started.t.
Once a month, examine these numbers:
MetricQuestion it answersCACWhat does it cost to acquire one customer?CAC by channelWhich channels are efficient or wasteful?ARPAHow much does an average account pay?Gross marginHow much revenue is left after delivery cost?Customer churnHow many customers leave?LTVHow much is a customer worth over time?LTV:CACIs acquisition profitable?CAC paybackHow long until acquisition cost is recovered?
Then write one sentence under each number:
“This changed because…”
That explanation is important.
Numbers alone do not help much if you do not explain them.
The goal is to understand why the metric changed and what you will do next.
My practical view
I do not think early-stage SaaS teams need perfect financial models.
But they do need clear thinking.
If you are still testing the product, your numbers may be messy. That is normal.
But even messy numbers can tell you something.
If paid users leave after one month, you have a retention problem.
If demos are expensive but close poorly, you have a sales or fit problem.
If organic users retain better than paid users, you have a channel-quality insight.
If one segment has strong LTV and another segment churns fast, you have a positioning decision to make.
Unit economics is not about turning into a spreadsheet expert.
It is about comprehending your business well enough to avoid spending money on the wrong kind of growth.
The bottom line
SaaS growth is not healthy just because revenue is going up.
Healthy growth means your business gets stronger as it grows.
That starts with unit economics.
Know what it costs to acquire a customer.
Know what that customer is worth.
Know how long it takes to recover your money.
Know which channels and segments are worth scaling.
Know where churn is damaging the model.
Then make better decisions.
If your CAC is too high, do not hide it inside blended averages.
If your LTV is weak, do not blame marketing before checking activation and retention.
If your payback period is too long, do not celebrate growth without looking at cash flow.
The goal is not to grow, no matter what it costs.
The goal is to build a SaaS business where growth makes your company stronger, not weaker.
Want more practical SaaS growth notes?
I write about SaaS growth, SEO, positioning, metrics, and product lessons from real work.
If you want practical notes like this in your inbox, join the newsletter.
No hype. No recycled guru advice. Just clear lessons on building better SaaS growth systems.
FAQ
What are SaaS unit economics?
SaaS unit economics measures the revenue and cost attached to one customer or account. It helps you understand whether a customer is profitable enough to justify the cost of acquiring and serving them.
What is CAC in SaaS?
CAC, or Customer Acquisition Cost, is the average amount you spend to acquire one new customer. The basic formula is sales and marketing costs divided by the number of new customers acquired.
What is LTV in SaaS?
LTV, or Lifetime Value, estimates how much gross profit a customer generates before they leave. A simple SaaS formula is average revenue per account multiplied by gross margin, divided by customer churn rate.
What is a good LTV:CAC ratio for SaaS?
A 3:1 LTV:CAC ratio is commonly used as a healthy SaaS benchmark, but it depends on your stage, sales motion, customer segment, and cash position. Use it as a diagnostic, not as a fixed rule.
What is the CAC payback period?
CAC payback period tells you how many months it takes to recover the money spent to acquire a customer. It is calculated by dividing CAC by the monthly gross margin per customer.
Why is CAC payback important?
CAC payback is important because it shows how much cash gets tied up in growth. A company can have strong LTV but still struggle if it takes too long to recover the acquisition cost.
How can a SaaS improve unit economics?
A SaaS can improve unit economics by reducing CAC, increasing LTV, improving gross margin, reducing churn, increasing ARPA, improving activation, and shortening CAC payback period.
Should early-stage SaaS companies track unit economics?
Yes, but they should not pretend the numbers are perfect. Early-stage data is often messy. The goal is to spot obvious leaks, compare channels and segments, and make better growth decisions.