TL;DR Summary
Most founders track too much data and gain too little insight. In this guide, I cut the vanity metrics and share the Learn-Test-Improve framework to reveal the acquisition, activation, and retention levers that truly scale a SaaS business.
Most SaaS teams do not have a data shortage. They have a focus problem.
They have a focus problem.
Their dashboards display visitors, signups, active users, monthly recurring revenue, customer loss, customer acquisition cost, and many other figures. But when growth slows, it is hard to know which number should get attention first.
SaaS metrics are only useful if they help you make a decision.
The right metric depends on what your business is trying to understand:
- Learn: Are the right users experiencing value?
- Test: Can you acquire and retain customers repeatedly?
- Improve: Can growth become increasingly efficient and sustainable?
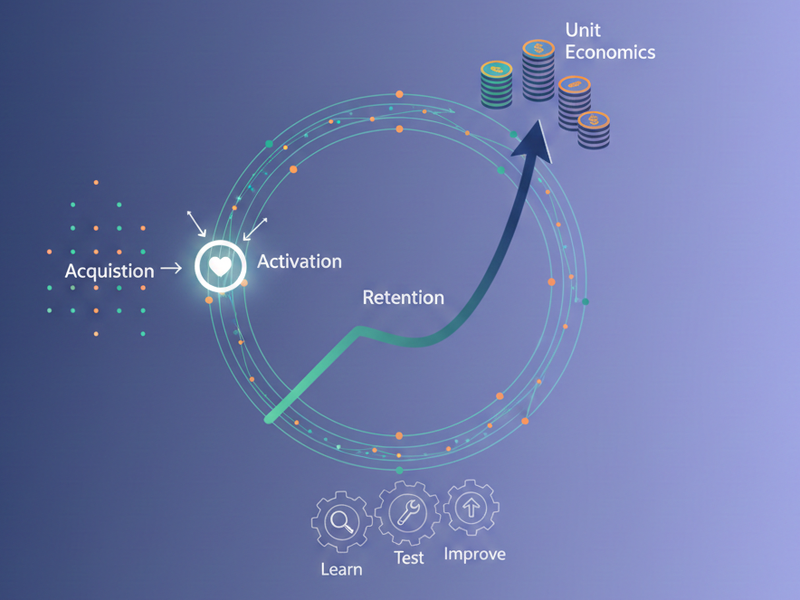
I call this the Learn-Test-Improveframework.
It helps you pick the right SaaS metrics for your current growth challenge, rather than filling your dashboard with every number possible.
What are SaaS metrics?
SaaS metrics measure the health of a subscription software business.
They usually cover five key areas:
- Acquisition
- Activation
- Retention
- Revenue
- Efficiency
You do not need to track all of them equally.
A useful metric should help you:
- Find a problem
- Understand what changed
- Choose what to investigate
- Test an improvement
- Judge whether the change worked
If a metric does not help you make a decision, it is mostly just decoration on your dashboard.
Stripe’s SaaS metrics guide also organizes key measurements around customer acquisition, engagement, retention, and recurring revenue. Which ones matter most depends on your product, pricing, and growth stage.
Why can more metrics create less clarity?
Traffic is not useless.
Signups are not useless.
Total users are not useless.
However, these numbers can be misleading if you see them as proof of real growth.
For example:
- Traffic can increase while qualified leads decline.
- Signups can rise while activation falls.
- New MRR can grow while churn wipes out the gain.
- CAC can look acceptable while payback becomes too slow.
- Average retention can hide one customer segment that leaves quickly.
The problem is not tracking these numbers.
The real issue is looking at these numbers without viewing the full picture.
A good SaaS dashboard should answer a few key business questions, not just display every number your tools can generate.
The Learn-Test-Improve metric map
StageMain questionMetrics to prioritiseLearnDo users reach and repeat meaningful value?Activation, time-to-value, cohort retentionTestCan we acquire and retain good customers repeatedly?Funnel conversion, CAC by channel, churn, NRRImproveCan growth become more efficient and durable?MRR movement, gross margin, LTV:CAC, CAC payback
These stages are not tied strictly to funding rounds. Instead, move to the stage that fits your biggest uncertainty.
A SaaS with funding may still need to fix activation. A self-funded product may already need to improve how quickly it recovers customer acquisition costs. A mature SaaS entering a new market may return to the Learn stage.
Choose the stage that fits your biggest uncertainty.
Stage 1: Learn whether users reach value
Early-stage SaaS teams often focus on registrations and revenue before understanding whether customers receive repeatable value.
At this stage, ask:
- What is the first useful result?
- How quickly do users reach it?
- Which early actions are connected to continued use?
- Why do some users disappear before experiencing value?
Three metrics help answer these questions.
1. Activation rate
Activation happens when a new user completes an action that shows they got important early value.
The event will be different for every product.
Examples might include:
- Creating and assigning the first project task
- Importing contacts and sending the first campaign
- Connecting to a data source and producing a report
- Sending the initial captured lead to its destination
The basic formula is:
Activation rate = Activated users ÷ New users × 100
The hard part is defining activation the right way.
Logging in usually does not count as activation. Finishing a product tour may not count either. The action should show the user has gotten a real result from the product.
What to do when activation is weak
Check:
- where users leave onboarding
- whether the setup asks for too much
- whether the first action is obvious
- whether templates or sample data would help
- whether the acquisition is attracting the wrong audience
Do not rush to add more tips.
First, find the point where conflict or friction begins.
2. Time-to-value
Time-to-value measures how long it takes a user to reach the activation event.
A simple self-serve product may deliver value during the first session. An enterprise product may require implementation, data migration or approval from several people.
There is no universal rule that every SaaS must activate users within five minutes.
The useful comparison is inside your own product:
- How quickly do retained users reach value?
- How long does it take users to churn later?
- Which onboarding path produces faster activation?
- Did a recent change reduce unnecessary setup?
What to do when value takes too long
You can:
- Remove optional steps from the initial setup
- Offer templates or default settings
- Let users begin with sample data
- Delay advanced configuration
- Guide users toward one clear result first
Speed is not the only goal.
The real aim is to reduce the gap between the user’s problem and a useful result.
3. Cohort retention
A blended retention number can hide important differences.
Cohort analysis groups users using a shared starting point, such as:
- signup month
- acquisition channel
- plan
- company size
- use case
- activation status
You may discover that organic users retain better than paid users, or that people who complete one integration remain customers longer.
This is more helpful than just knowing your average churn rate.
Mixpanel’s guide to cohort analysis provides a useful explanation of how grouping users by a shared starting point or behaviour can reveal where they find value and where they drop away.
What to look for
Ask:
- Which cohorts retain the best?
- What did those users do differently?
- Which source brought them?
- Which use case did they have?
- Did newer cohorts improve after a product change?
Your goal in the Learn stage is to identify the users, actions and journeys connected to real product value.
Stage 2: Test whether growth is repeatable
Once some users consistently receive value, the next question is whether you can attract and retain more of them.
This is the Test stage.
Here, metrics should help you compare channels, messages, onboarding flows, segments and offers.
4. Funnel conversion
A basic SaaS journey may look like this:
Visitor → Signup → Activated user → Paid customer → Retained customer
Measure the conversion between each stage.
A landing page may generate many registrations but very few activated customers. Another page may create fewer signups but bring much better users.
This is why signup conversion alone can be misleading.
For each channel or campaign, compare:
- visitor-to-signup
- signup-to-activation
- activation-to-paid
- paid-to-retained
Do not focus only on getting the cheapest registrations.
Focus on attracting customers who find value and stick around.
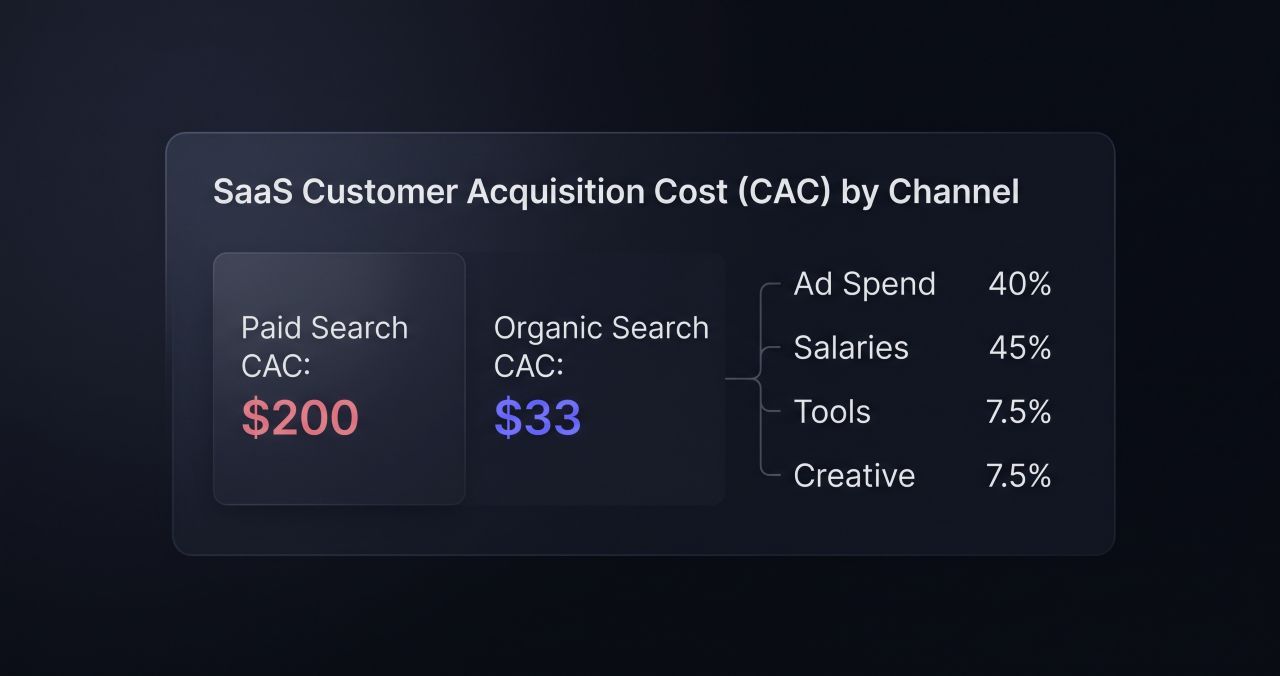
5. Customer Acquisition Cost by channel
Customer Acquisition Cost, or CAC, estimates what you spend to acquire one customer.
The basic formula is:
CAC = Sales and marketing costs ÷ New customers acquired
Whenever possible, calculate it separately for:
- paid advertising
- organic search
- outbound
- affiliates or partnerships
- sales-led acquisition
- self-serve acquisition
A blended CAC can hide a weak channel if a stronger channel is making the average look better.
CAC alone does not tell the whole story. Sometimes, a more expensive channel is better if it brings customers who stay longer or buy bigger plans.
For a deeper breakdown, read my guide to SaaS unit economics.
6. Customer and revenue churn
Customer churn measures the percentage of customers who leave.
Revenue churn measures how much recurring revenue disappears.
These can tell different stories.
Losing several small customers may have a limited revenue impact. Losing one large account may barely move customer churn but seriously affect MRR.

Segment churn by:
- plan
- customer size
- acquisition source
- use case
- activation status
- customer age
Then investigate why each group leaves.
Possible causes include:
- wrong audience
- weak onboarding
- low product usage
- missing value
- poor reliability
- price-value mismatch
- a naturally temporary use case
Churn is just a symptom.
You still need to find the cause.
7. Net Revenue Retention
Net Revenue Retention, or NRR, shows how recurring revenue from an existing customer group changes after expansion, contraction and churn.
The common formula is:
NRR = (Starting MRR + Expansion − Contraction − Churned MRR) ÷ Starting MRR × 100
ChartMogul’s documentation on Net MRR Retention explains how NRR accounts for gains from expansion and reactivation alongside losses from contraction and churn.
If NRR is above 100%, it means expansion revenue was greater than the revenue lost from downgrades and churn during that time.
But there is no single NRR benchmark for every SaaS.
ChartMogul’s retention research shows that retention differs substantially based on average revenue per account, company size and customer type.
Use NRR to understand:
- Whether existing revenue is growing or shrinking
- Whether customers have a natural expansion path
- Whether upsells are hiding weak underlying retention
- Which customer segments deserve more focus
Stage 3: Improve growth quality
After acquisition and retention are more predictable, the next step is to improve efficiency.
The question changes from:
Can we grow?
To:
Can we grow without making the business weaker?
8. MRR movement
Monthly Recurring Revenue should not be viewed as one total number.
Break it into:
- New MRR
- Expansion MRR
- Contraction MRR
- Reactivation MRR
- Churned MRR
This shows how revenue actually changed.
Two SaaS companies can add the same net MRR while having very different businesses.
One may grow through strong retention and expansion. The other may spend aggressively to replace revenue lost through churn.
For a clearer explanation, read my guide to ARR and MRR.
Growth mechanics, zero fluff.
Join SaaS founders and operators getting weekly notes and tear-downs on organic acquisition and churn reduction.
9. Gross margin
Gross margin shows how much revenue remains after the direct cost of delivering the product.
Direct costs may include:
- Hosting and infrastructure
- Third-party APIs
- Payment processing
- Direct support
- Implementation is required to deliver the service
This matters because two customers paying the same price may not create the same gross profit.
AI-heavy, API-based and service-supported SaaS products can have very different cost structures from traditional subscription software.
Revenue growth does not mean much if your delivery costs increase just as fast.
10. LTV:CAC and CAC payback
LTV:CAC compares estimated customer lifetime value with acquisition cost.
CAC payback estimates how long it takes to recover the acquisition cost through gross profit.
These metrics answer different questions:
- LTV:CAC: Is the customer valuable enough to justify acquisition?
- CAC payback: Can the company recover the cash quickly enough?
A SaaS business might have a great lifetime value but still struggle with cash flow if payback takes too long.
Do not treat ratios such as 3:1 or a particular payback period as universal rules. Interpret them based on:
- customer segment
- gross margin
- sales cycle
- contract length
- churn
- expansion revenue
- company cash position
The goal is to make better decisions, not just collect benchmark badges.
How to use the Learn–Test–Improve cycle
This system is only helpful if it changes your actions.
Learn
Choose the metric connected to your current bottleneck.
Example:
Activation dropped after the onboarding redesign.
Break the number down by device, source, plan or onboarding step.
Test
Create one clear hypothesis.
Example:
We believe users fail to activate because the empty dashboard does not show the first useful workflow. Adding a prebuilt template should improve activation.
Define the change, audience, target metric and review period.
Improve
Compare the result with the previous baseline.
Then:
- keep the change
- refine and test it again
- roll it back
- investigate another cause
- apply the learning elsewhere
The goal is not to win every experiment.
The goal is to stop repeating the same assumptions.
For a practical testing process, use my SaaS growth experiment framework.
The dashboard I would start with
You do not need dozens of charts.
Start with these questions:
Business questionMetricAre users reaching value?Activation rateHow quickly do they reach it?Time-to-valueDo they continue receiving value?Cohort retentionAre we converting good customers?Funnel conversionWhat does acquisition cost?CAC by channelAre customers and revenue staying?Churn and NRRHow is recurring revenue changing?MRR movementIs acquisition economically healthy?LTV:CAC and CAC payback
Only add another metric if it helps you make a real decision.
Common SaaS metric mistakes
Tracking everything equally
Not every metric deserves equal attention.
Prioritise the one connected to your current constraint.
Copying benchmarks blindly
Benchmarks change with pricing, ACV, audience, company stage and sales model.
Use them to ask questions, not to declare success.
Mixing customer segments
Self-serve customers and enterprise accounts often have very different acquisition, retention and expansion patterns.
Segment before deciding.
Optimising signups before activation
More registrations will not fix a process where users never reach value.
It just makes the problem bigger.
Reporting without acting
Every metrics review should finish with a decision, investigation or experiment.
Otherwise, it is simply reporting.
The bottom line
The best SaaS metrics do more than just describe growth.
They help you improve growth.
Use activation, time-to-value and cohorts to learn whether users experience value.
Use conversion, CAC, churn and NRR to test whether growth is repeatable.
Use MRR movement, gross margin and unit economics to improve growth quality.
Then repeat:
Learn > Test > Improve
Do not aim for the biggest dashboard.
Build the smallest dashboard that actually helps you make better decisions.
Get practical SaaS growth notes
I document practical lessons on SaaS growth, SEO, positioning, metrics and product work.
Sign up for the newsletter to get practical frameworks and lessons you can really use.
No hype. No recycled guru advice. Just clearer thinking from real SaaS growth work.
FAQ
What are the most important SaaS metrics?
The most important metrics depend on the current business problem. Early products should prioritise activation, time-to-value and cohort retention. SaaS companies testing repeatable growth should track conversion, CAC, churn and NRR. Scaling companies should add MRR movement, gross margin, LTV:CAC and CAC payback.
How many SaaS metrics should be on a dashboard?
There is no perfect number, but the main dashboard should remain focused. Start with the metrics needed to answer your current business questions. Add a metric only when it supports a decision, investigation or experiment.
What is a vanity metric in SaaS?
A vanity metric looks positive but provides little insight when viewed alone. Total page views, registrations or followers can become vanity metrics when they are not connected to activation, retention, qualified customers or revenue.
What is the best metric for an early-stage SaaS?
Activation and cohort retention are usually the best starting points. They show whether users reach a meaningful value and continue using the product. Revenue efficiency metrics become more useful after the business has reliable customer and retention data.
What is the difference between a metric and a KPI?
A metric is any measurable business value. A KPI is a metric selected as especially important to a current goal. Every KPI is a metric, but not every metric needs to become a KPI.
What does NRR mean in SaaS?
Net Revenue Retention measures how recurring revenue from an existing customer group changes after expansion, contraction and churn. An NRR above 100% means expansion exceeded the revenue lost during the measurement period.